Custom Format Labels
- Serena Purslow
- Apr 10, 2025
- 1 min read

Hey Tableau Community! Did you know that you can use the text editor in the Marks Card to customise the labels on your charts?
Adding marks to a chart in Tableau is a great way to call out and highlight key values, however unless we format these marks variables, they tend to fall flat.
Take this lovely donut chart - we want to call out a few values here, the % held by each category, and then the total they make up in the centre. However, the default formatting options don't look great, and don't help us highlight these numbers!

So, how do we customise our marks labels?
How to do it:
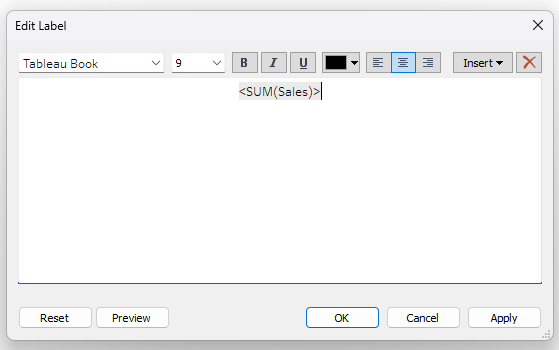
First we want to navigate to the label option on the Marks Card and select 'Label'. This will open up a tab with various options, but the one we want to select is the '...' next to the Text option:

This will open up a text editor in which you have lots of freedom to format your marks labels exactly as you like! You can play around with the font, sizing, and colouring of your labels, and you can apply these options differently to different elements on your labels! You can even type in extra text here if needed.
Transforming text like this:
To text like this:

By playing around with the text in this formatting box, we can update our donut chart labels from the basic Tableau settings, to some labels that actually stand out a bit!

I hope you find this trick useful! If you have any Tableau related questions feel free to let me know!

Comments